Analyzing Spotify's Top 100
Cornell CS 3300 — Data-Driven Web Applications
Organization
Cornell University
Role
Designer & Developer
Skills
About
Spotify's top 100 tracks of 2017 were collectively streamed billions of times, which makes them an interesting dataset to work with: by definition, every song in the list is already mainstream. What I wanted to figure out was what still separates one hit from another once you only look at the top of the charts.
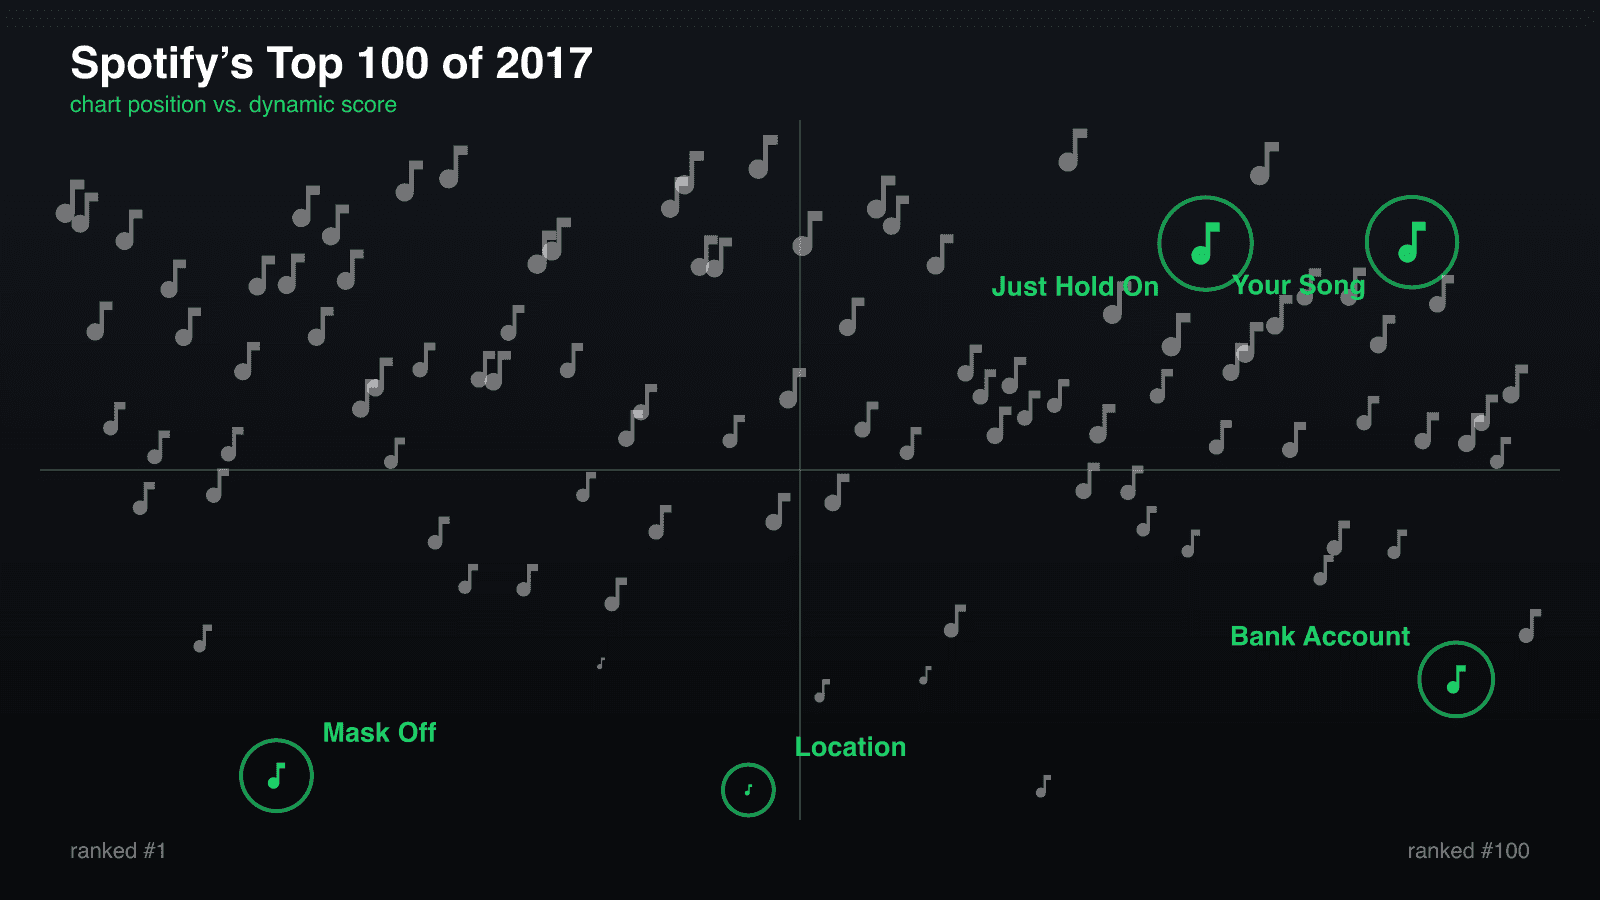
I pulled the audio features from Spotify's Web API for every track — loudness, energy, valence, speechiness, tempo, danceability, and the rest — and ran principal component analysis (PCA) over them. Five features dominated the first principal component, which I combined into a single 'dynamic score' and plotted against chart position. High-energy party tracks rise to the top, chill songs sink to the bottom, and the horizontal axis tracks chart rank from #1 to #100.
You can see the formula working by looking at the five outliers: Khalid's Location is the quietest track in the Top 100, Steve Aoki's Just Hold On is the most energetic, Rita Ora's Your Song is the happiest, Future's Mask Off is the most vocal-heavy, and 21 Savage's Bank Account is the slowest. All five sit right on the outer edges of the plot — which is exactly what you want a scoring formula to do.
Below the main plot, barcode strip charts break down where all 100 songs land across each individual factor, paired with scannable Spotify codes on the five outlier cards so you can play the tracks and hear what the numbers are describing. (Originally built in D3.js in 2018, the interactive piece below has been rebuilt directly from the source dataset in raw SVG.)
Tools Used
Analyzing Spotify's Top 100 Songs of 2017
Spotify's top 100 tracks have been collectively listened to billions of times. We picked five outliers to help us determine the factors that make songs unique.
Each one of these five songs is an outlier in a different factor. These factors, combined, determine how dynamic a song is. We used principal component analysis (PCA) to find them — PCA tells us mathematically that they are the most significant factors in the dataset.
These five factors are, from most to least important: loudness, energy, valence, speechiness, and tempo.
Each factor is standardised before scoring, and the score is oriented so that a higher number means louder, livelier and happier — the direction the plot above reads upward.
Let's look at each of these factors in more detail.
There is a wide range of volume among songs in the Top 100. Softer songs such as Location by Khalid, however, are noticeably less represented.
Energy is more evenly distributed. That said, Just Hold On by Steve Aoki is noticeably more energetic than the next closest song, Galway Girl by Ed Sheeran.
Valence is also evenly distributed — the mean sits almost exactly halfway between happy and sad. Your Song by Rita Ora is about as happy as a song can possibly be. (At least by Spotify's metrics.)
By Spotify's definition, values above 0.33 indicate both music and speech, while values below 0.33 represent non-speech-like tracks. No track went above 0.66, which would mean an entirely spoken-word track. Mask Off by Future is one of the few vocal-heavy rap tracks to make the Top 100.
Tracks are evenly spaced in the low 100 BPM region, and there are fewer tracks with higher tempos. Bank Account by 21 Savage tied with iSpy (feat. Lil Yachty) by KYLE for the slowest tempo.
Now scroll back up to the main visualisation. Notice how each outlier lies towards the edges of the plot? That means the formula correctly recognises the factors that distinguish outliers — and, conversely, what makes a song mainstream.
Loudness, energy, valence, speechiness and tempo make songs distinctive and differentiate them from each other, even when considering only the Top 100 songs on Spotify.
Interested in hearing this for yourself? Scan the Spotify code on any card to play the track.
Location
Khalid

Just Hold On
Steve Aoki

Your Song
Rita Ora

Mask Off
Future

Bank Account
21 Savage

Data from the Spotify Web API via Kaggle. Spotify codes generated through Spotify.